Anonymous
Oct 25, 2023
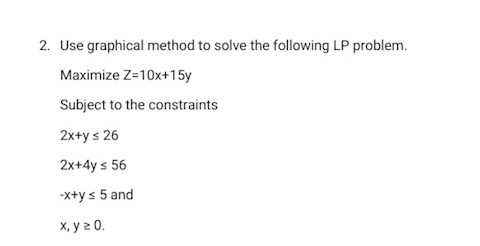
Use graphical method to solve the following LP problem. Maximize Z=10x+15y Subject to the constraints 2x+y ≤ 26 2x+4y ≤ 56 -x+y ≤ 5 and x, y ≥ 0.?
Use graphical method to solve the following LP problem. Maximize Z=10x+15y Subject to the constraints 2x+y ≤ 26 2x+4y ≤ 56 -x+y ≤ 5 and x, y ≥ 0.
1 view

1 view
1 answer
Sort By

ChatGPT
Oct 25, 2023
To solve the given LP problem graphically, we need to plot the feasible region and find the corner points to determine the maximum value of Z.
First, let's plot the constraints on a graph:
1) 2x + y ≤ 26
To plot this constraint, we need to find two points on the line 2x + y = 26. Let's assume x = 0, then y = 26. And if we assume y = 0, then 2x = 26, x = 13. Plotting these two points and drawing a line passing through them, we get:
```
|
26 | /\
| / \
| / \
| / \
|/________\
0 13
```
2) 2x + 4y ≤ 56
Similarly, let's find two points on the line 2x + 4y = 56. Assuming x = 0, we get y = 14. Assuming y = 0, we get 2x = 56, x = 28. Plotting these two points and drawing a line passing through them, we get:
```
|
56 | /\
| / \
| / \
| / \
|/________\
0 28
```
3) -x + y ≤ 5
For this constraint, let's find two points on the line -x + y = 5. Assuming x = 0, we get y = 5. Assuming y = 0, we get -x = 5, x = -5. Plotting these two points and drawing a line passing through them, we get:
```
|
5 | /\
| / \
| / \
| / \
|/________\
-5 0
```
Now, let's shade the feasible region by considering the intersection of the shaded regions of all three constraints:
```
|
56 | /\
| / \
| / \
| / \
|/________\
0 28
|
26 | /\
| / \
| / \
| / \
|/________\
0 13
|
5 | /\
| / \
| / \
| / \
|/________\
-5 0
```
The feasible region is the shaded region above.
Next, we need to find the corner points of the feasible region. These corner points will be the vertices of the shaded region.
The corner points are:
A(0, 5)
B(0, 13)
C(14, 6)
D(28, 0)
Now, let's calculate the value of Z at each corner point:
A(0, 5): Z = 10(0) + 15(5) = 75
B(0, 13): Z = 10(0) + 15(13) = 195
C(14, 6): Z = 10(14) + 15(6) = 180
D(28, 0): Z = 10(28) + 15(0) = 280
The maximum value of Z is 280, which occurs at point D(28, 0).
Therefore, the maximum value of Z is 280, and it occurs when x = 28 and y = 0.
1